Research Projects
Drought Monitoring
Remote sensing technology plays a crucial role in water resource analysis, allowing us to monitor, understand, and predict changes in water resource data from different satellite missions and Land Data Assimilation Systems (LDAS). By developing and utilizing advanced analytical tools and models, we can gain valuable insights into the state of water resources globally, and support decision-making processes for sustainable development.
With our focus on this research on drought monitoring, as an essential tool for managing the impacts of drought, we intend to provide an early warning system, informing resource management decisions, supporting disaster preparedness, and policy development. With increasing frequency and severity of droughts due to climate change, the drought monitor is becoming even more critical for mitigating the impacts of drought and ensuring the sustainable use of natural resources.
Methodology
Our methodology for analyzing water resources, especially soil moisture data analysis, includes a range of scientific and technical approaches, including data processing, quality control, modeling, validation, spatial analysis, and data visualization. These techniques are used to provide valuable information for drought monitoring, flood prediction, and water resource management. Our methodology can also be adapted to different regions and applications, providing a flexible and robust tool for soil moisture science and drought management.
Several techniques can be used to acquire and extract relevant datasets including:
-
Ground-based sensors: These sensors are installed in the ground to directly measure the moisture content. They can be placed at different depths and locations to provide a spatially distributed measurement of soil moisture.
-
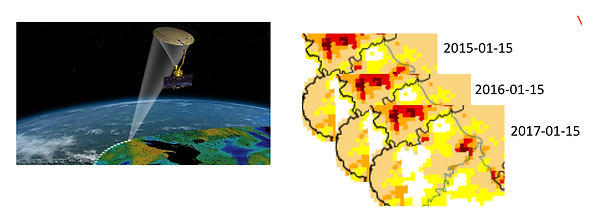
Satellite data: Satellite-based sensors, like the SMAP mission, offer global coverage of soil moisture levels. They use microwave radiation to estimate soil moisture levels and provide data at regular intervals.
-
Aircraft-based sensors: These sensors are installed on aircraft and can measure soil moisture levels from the air. They provide high-resolution data over specific areas and can be used for research or monitoring purposes.
-
Portable soil moisture meters: These meters can measure soil moisture levels at specific locations and are easy to use. They provide quick measurements of soil moisture levels.
-
Weather stations: Some weather stations are equipped with soil moisture sensors that measure soil moisture levels in addition to other weather variables, such as temperature, humidity, and precipitation.
-
Soil maps: These maps provide estimates of soil moisture levels based on soil type and other soil properties. They can be used to estimate soil moisture levels for large areas.
To meet our objective of providing global coverage of soil moisture data, we mainly used satellite data. The SMAP and GRACE satellite missions have proven to be invaluable tools in water resources analysis and drought monitoring, providing valuable information for water resource management.
Based on a review of literature on SMAP L4 soil moisture data analysis, several methods have been identified for analyzing this dataset. These methods include:
1. Quality control and data processing measures: such as outlier detection, error correction, and data validation can be used to ensure the accuracy and reliability of the data.
2. Statistical analysis: such as correlation analysis, regression analysis, and principal component analysis can be used to explore the relationships between soil moisture and other environmental variables. These techniques can also be used to identify trends and patterns in the data.
3. Spatial analysis: such as geostatistics and spatial interpolation can be used to generate spatially continuous maps of soil moisture. These maps can reveal the spatial patterns and variability of soil moisture across a region.
4. Machine learning and artificial intelligence: such as neural networks, support vector machines, and random forests can be used to predict soil moisture levels based on historical data and environmental variables. These models can also be used to generate future projections of soil moisture levels under different scenarios.
5. Time-series analysis: Autoregressive Integrated Moving Average (ARIMA) and wavelet analysis can be used to explore the temporal patterns and variability of soil moisture data. These techniques can also be used to identify trends and cycles in the data.
Overall, the combination of these methods allows for a comprehensive analysis of SMAP L4 soil moisture data, which can provide insights into the dynamics of soil moisture and its environmental implications.
Results:
Creating a drought monitor from soil moisture data involves several steps. First by Obtaining soil moisture data: The data should cover the desired region and time period. Followed by calculating the soil moisture anomalies: Calculate the deviation of the current soil moisture from the long-term average soil moisture in the region of interest. This can be done by subtracting the long-term average soil moisture from the current soil moisture data. Afterward, we choose the drought index that is appropriate for the specific region and application. Some common drought indices include the Standardized Precipitation Index (SPI), the Palmer Drought Severity Index (PDSI), the Standardized Soil Moisture Index (SSI), and the Soil Moisture Anomaly (SMA). This is followed by applying the chosen drought index to the soil moisture anomalies to create a drought monitor. The drought monitor will classify areas as being in normal, moderate, severe, or extreme drought based on the index values.
Finally, we visualized the drought monitor using maps, graphs, or other visualizations to make it easy to interpret the data. The visualization should highlight the areas that are experiencing drought and the severity of the drought. As a last step, we validate the results of the drought monitor by comparing them to other meteorological and hydrological data, such as precipitation, streamflow, and vegetation health. This will help to ensure the accuracy and reliability of the drought monitor.
By combining remote sensing data with other data sources such as satellite-based rainfall estimates, surface temperature, vegetation indices, atmospheric data, and ground measurements, comprehensive drought monitoring tools can be developed, providing crucial insights into the state of water resources and guiding effective water resource management strategies. While the limitations of remote sensing data should be considered, its importance in water resource analysis and drought monitoring cannot be overstated. With the growing scarcity of water resources, the use of remote sensing data is likely to become even more important in the coming years, providing crucial insights into the state of water resources and guiding effective water resource management strategies, including early warning systems, drought impact assessment, and decision-making support.


Cooperation
Get in touch with us via info@nabtaplaya.de to find the best way of cooperation:
-
Partnership with your association
-
Become a member
-
Do your master or undergraduate project with us
It's important to note that creating a drought monitor from soil moisture data requires expertise in both data science and drought monitoring. It's also important to consider other factors that can contribute to drought, such as temperature, precipitation, and vegetation health, when interpreting the results of a drought monitor.